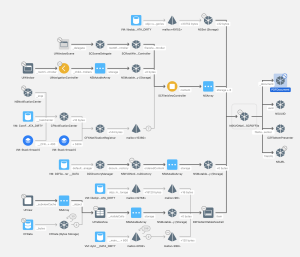
We continually strives to enhance user engagement by bolstering the stability of our applications. A pivotal aspect of this endeavor is the eradication of any retain cycles and memory leaks within our extensive code repositories. We leverage the Memory Graph Debugger for its efficiency in identifying and rectifying such issues.
Retain Cycles and Memory Leaks Explained
In iOS, a memory leak happends when memory that has been allocated is unable to be freed, often due to retain cycles. Swift’s and Objective-C’s Automatic Reference Counting (ARC) contributes to a retain cycle when multiple objects maintain strong references to each other, leading to an inability to release them from memory, as their retain counts do not drop to zero, thereby preventing the deinit/dealloc method from being called.
The Importance of Addressing Memory Leaks
Memory leaks can subtly enlarge your app’s memory usage, leading to a forced shutdown by the operating system, known as an OOM crash, if unaddressed. Moreover, leaks can spawn erratic behaviors or crashes, especially when leaked observers continue to receive notifications they should no longer be privy to.
Utilizing Xcode’s Memory Graph Debugger
![]()
Initiate by running your app and clicking the 3-node icon situated amidst the visual debugger and location simulator buttons. This action captures a snapshot of your app’s current memory state. The resulting panel displays the memory-resident objects and their instances. By selecting an object, Xcode illustrates the reference chain maintaining the object in memory, with bold lines indicating strong references. Although the debugger can flag simple memory leaks, it’s not infallible, necessitating manual inspection at times.

A Memory Graph in Xcode
Methodology for Memory Graph Debugger Utilization
A systematic method to uncover leaks involves executing core app functions, exiting, and repeating the process while capturing memory snapshots. Signs of retain cycles or leaks include unexpected objects in memory, multiplying instances of a single class, and increased memory consumption. To rectify a leak, trace the chain of retaining objects using the object graph, then examine your code to resolve the strong reference loop.
Proactive Measures Against Retain Cycles
To forestall retain cycles, be cautious with closures and blocks and ensure weak references where necessary, particularly with protocol-typed properties requiring a class constraint. The delegation pattern, among other design approaches, mandates weak delegation to prevent cycles. Utilizing the Xcode Memory Graph Debugger simplifies the detection and resolution of such memory issues, an invaluable tool for developers.